¶ Building Charts in Maven Documents
Power up your Maven Documents template with a chart using the Quick Chart plugin.
Here is a quick example of how you can build and embed a chart into your document
-
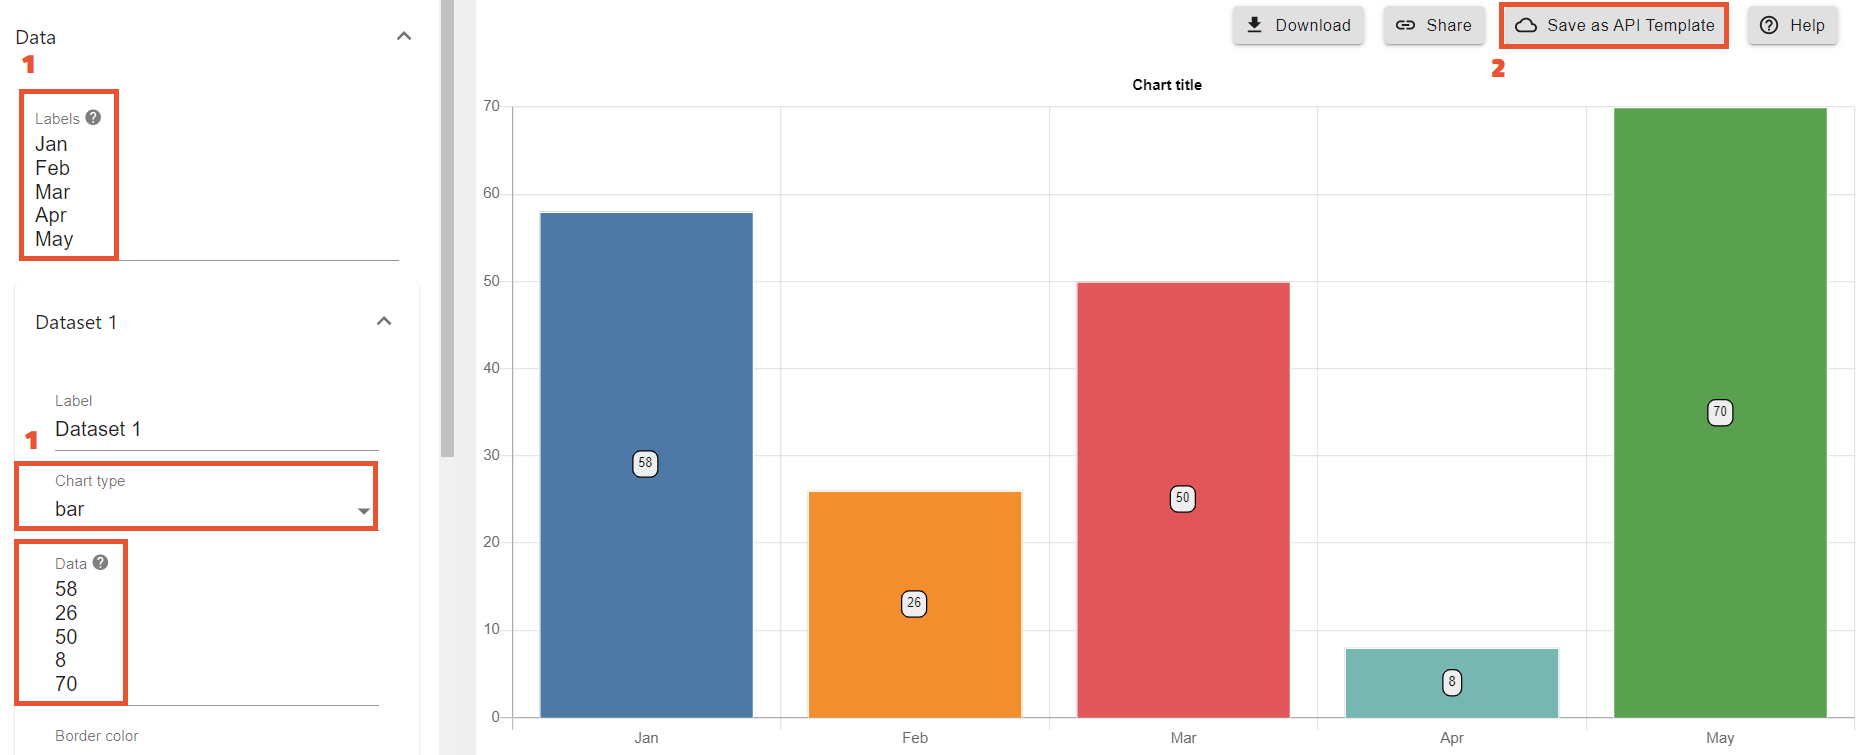
Go to QuickChart Chart Maker and create a template of the chart, using some dummy data. Don't worry about the data at this stage because we will change it later. You can use the following instruction

-
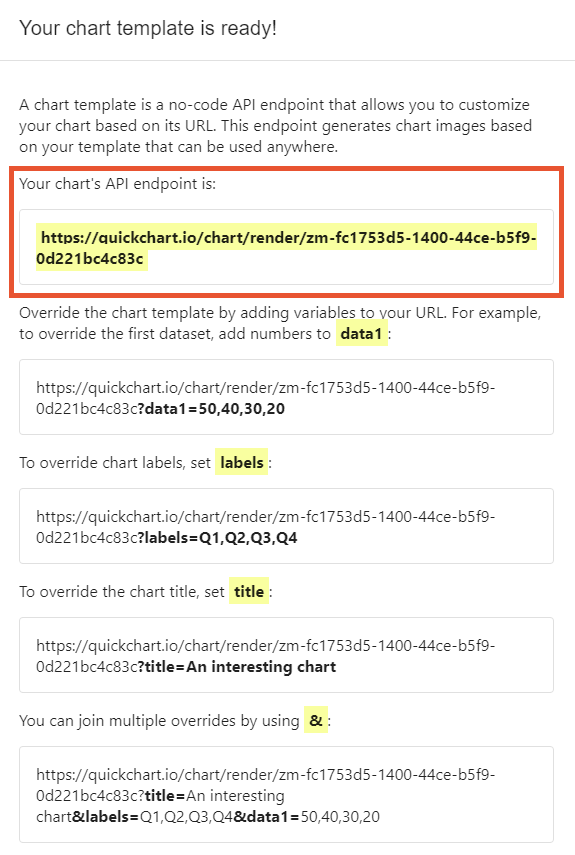
Click on "Save as API Template" and copy the chart's API endpoint from the corresponding field

-
Go to the template document and open Maven Documents Template Builder
-
In the "Elements" tab, select the "Image" element
-
Give it a name, and switch the toggle on next to the URL field
-
Open Expression Builder and paste the copied endpoint into the text field
-
Edit the URL by adding or changing variables such as data, labels, or title. The following instruction will help.
Since we are using JEXL language, please be aware of the syntax used. For example, all string values shall be wrapped in single quotation marks ('). You can learn more about Expressions here.
-
When finished, click "Insert Expression"
-
Set the "Width" and "Height" parameters and click "Insert Element"
In the example below, we built a chart that shows Opportunity Amount grouped by Stages, using Global Variables, "groupBy" and "join" expressions.
'<mdoc:image name="Chart" url="{!$'https://quickchart.io/chart/render/zm-e33b5137-6a1b-41d0-aff9-7a136d4fad4d?data1=' + sum(GroupedbyStageVar.GroupbyStage, 'Amount') + ‘,’ + sum(GroupedbyStageVar[1].GroupbyStage, 'Amount') + ‘,’ + sum(GroupedbyStageVar[2].GroupbyStage, 'Amount') + ‘,’ + sum(GroupedbyStageVar[3].GroupbyStage, 'Amount') + ‘,’ + sum(GroupedbyStageVar[4].GroupbyStage, 'Amount') + ‘,’ + sum(GroupedbyStageVar[5].GroupbyStage, 'Amount') + ‘,’ + ‘&labels=’ + join(GroupedbyStageVar, 'StageName', ‘,’) + ‘&title=’ + ‘Opportunities by Stage’}" width="700" height="400"/>'
When the document is generated, it will show a nice and informative chart in your document.
