¶  Unit Tests
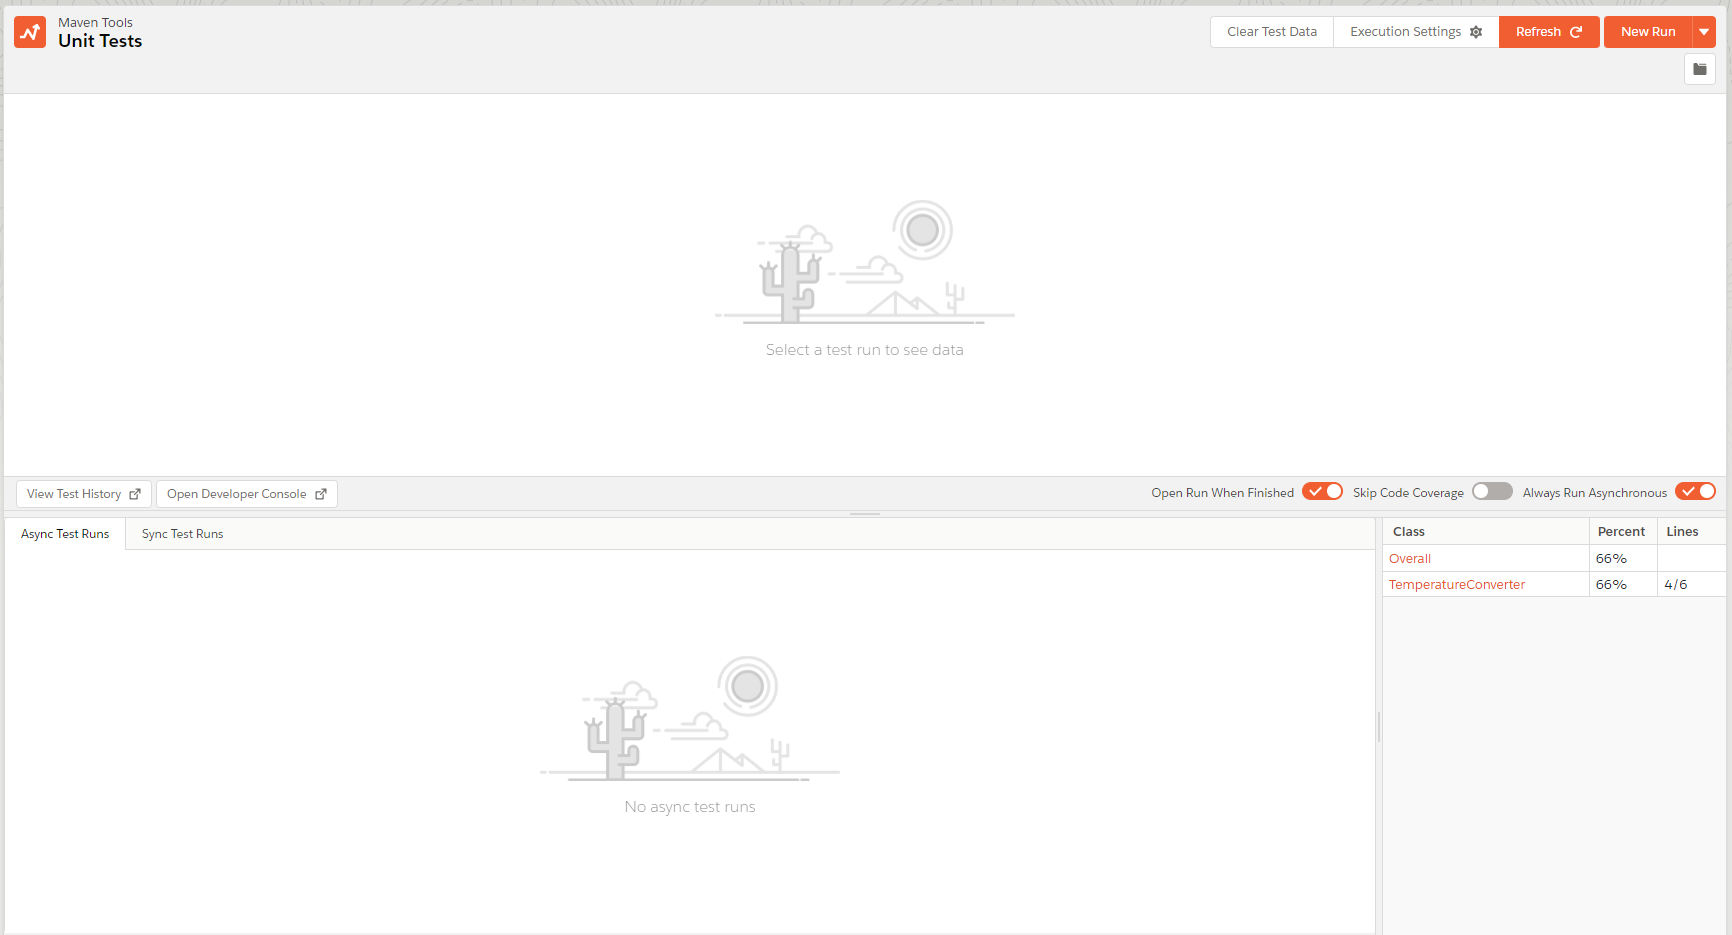
Testing your Apex code is necessary when developing and deploying your Salesforce solutions. The Unit Tests module allows you to start and abort test runs, inspect test results and check your code coverage. Tests can be executed asynchronously, allowing you to continue using Maven Tools while waiting for the test results.
¶ Loading test runs
Upon opening the Unit Tests module, it promptly initiates the loading of all accessible test classes, test runs, and code coverage. Additionally, Maven Tools ensures the presence of an active trace flag, which is necessary for generating debug logs during your test runs. Clicking the 'Refresh' button will reload this data, proving beneficial when incorporating a new test class or verifying the completion of an asynchronous test run before the timer ticks.

¶ Executing and aborting test runs
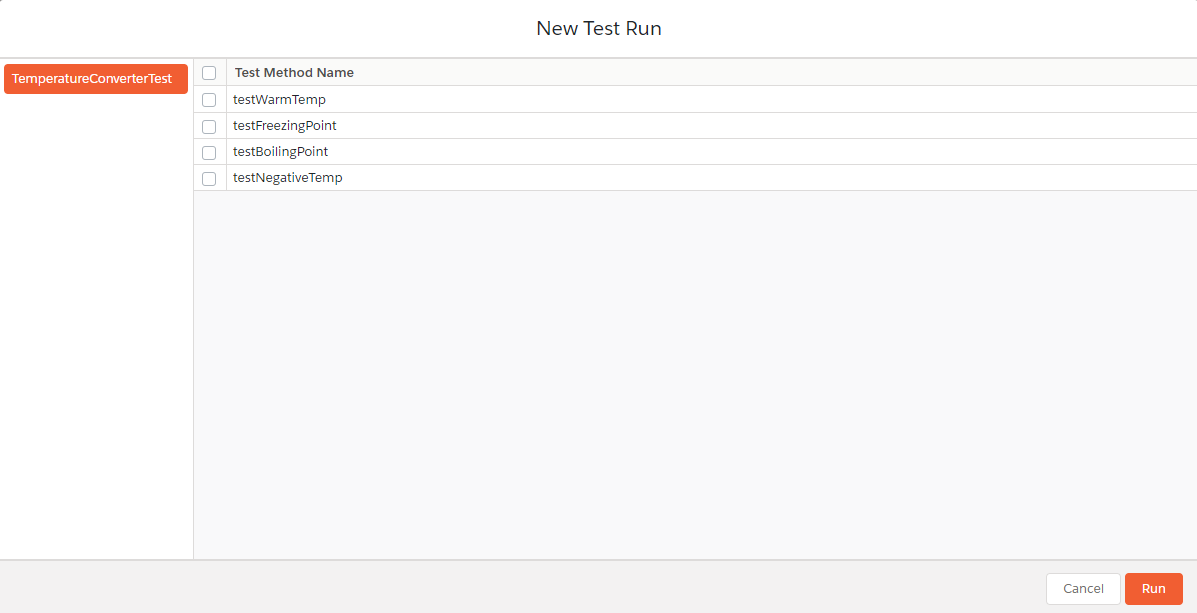
To create a new test run, click on the 'New Run' button, select which test classes and methods you would like to include and press 'Run'. If you are running tests asynchronously, your new test run will appear in the bottom pane. Running test runs synchronously means your test run will start immediately and you will have to wait for execution to finish, afterwards your test results will appear in the bottom pane of the module.
When you begin a new async test run, an API request is made which informs Salesforce to add it to the Apex test queue. Maven Tools will query Salesforce for test results of the run with an API request every 10 seconds until execution is finished.
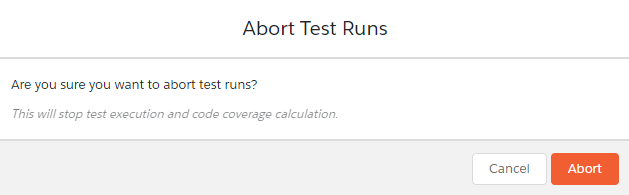
While a test run is processing, you have the option to abort it. Aborting test runs halts execution and returns results only for test methods which managed to complete in time. To abort a test run, mark the checkbox next to its ID, click on the dropdown menu of the 'New Run' button and select 'Abort Selected'.
¶ Viewing test runs and inspecting results
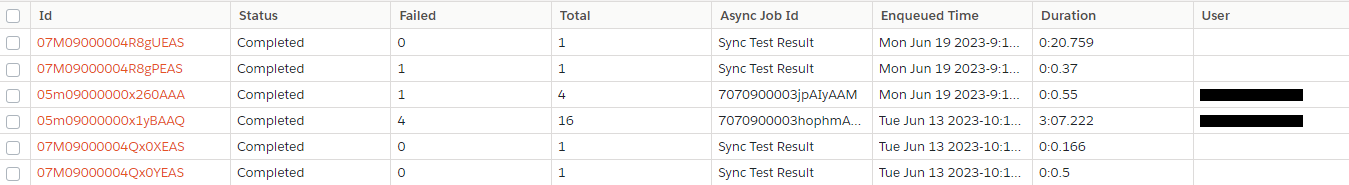
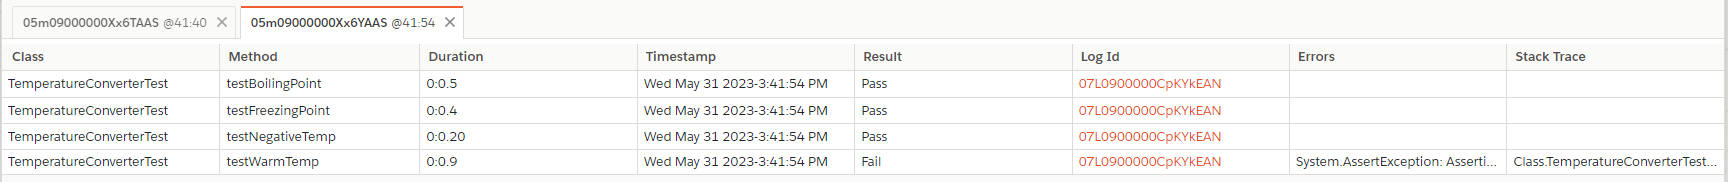
All your previous and future test runs will be located in the bottom pane of the module. Clicking on an ID of any async test run will load and open its test results in a new tab in the top pane. Test results contain information about status and duration of each method and any eventual errors which might appear during execution. Select any Log ID to open it in the Debug Log module.
¶ Code coverage
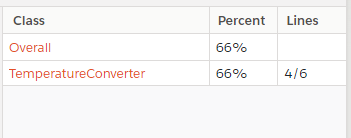
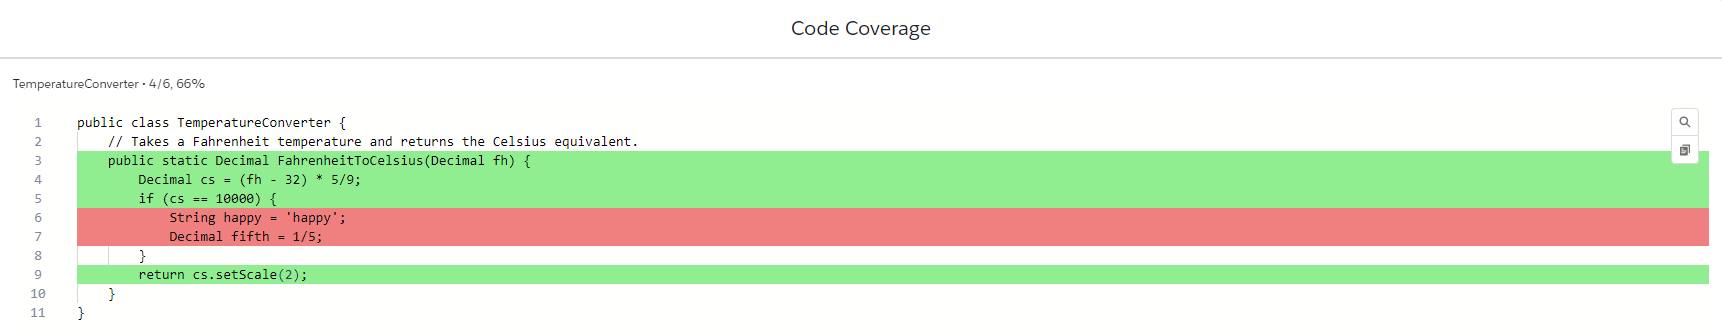
The bottom right pane of the module displays code coverage for each Apex class. The overall code coverage is available in the first row of the table. Clicking on any Apex class will open its body, with covered lines highlighted in green and uncovered lines highlighted in red. Please note that this table displays the aggregate code coverage.
¶ Run options
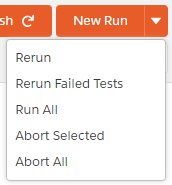
Run options are located in the dropdown menu of the 'New Run' button.
- Rerun: Restart execution of currently selected test runs
- Rerun Failed Tests: Restart execution of failed test methods in the currently selected test runs
- Run All: Run all available test classes with all of their test methods
- Abort: Abort selected test runs
- Abort All: Abort all test runs and clear the Apex Test Queue, this option should be used when test classes become stuck and cannot be executed
¶ Execution settings
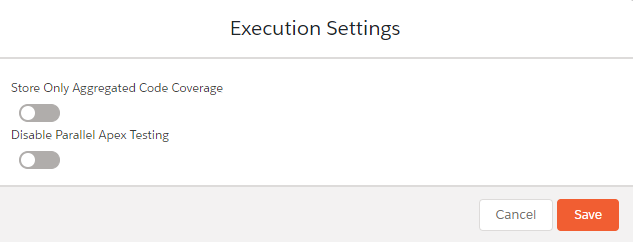
Clicking on the 'Execution Settings' button allows you to set additional preferences:
- Store Only Aggregate Code Coverage: Calculate code coverage as a sum of all test classes
- Disable Parallel Apex Testing: Allow only one test run to be active at a time
¶ Clear test data
To clear test data click on the 'Clear Test Data' button. This option deletes all test runs and test results as well as individual code coverage for each test run.
![]()
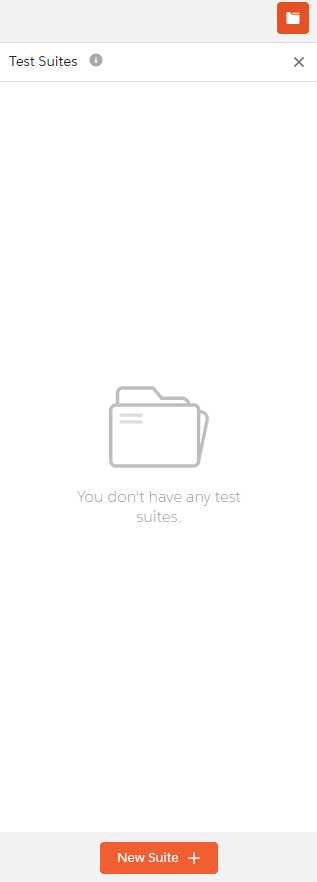
¶ Test suites
You can create a test suite if you often group the same test classes together. To create, edit, view and start test suites, click on the folder button located under the 'New Run' button.
¶ Toggle options
Options you can toggle:
- Open Run When Finished: Open test results automatically when a test run is finished
- Skip Code Coverage: Do not calculate code coverage for test runs
- Always Run Asynchronous: Run tests asynchronously in the background

¶ Max failed tests
To configure the maximum number of failed methods that can occur before a test run is canceled, navigate to Maven Tools settings. The default value is -1, indicating that the test run will not be canceled due to failed methods.
