¶  Debug Logs
When writing your Apex code in Salesforce, debug logs can help you a lot when trying to debug your code. The debug log contains information about each transaction, such as whether it was successful and how long it took. Maven Tools offers you to view, filter, export and delete your logs all in one place - the Debug Logs module.
¶ Loading Debug Logs
When you open the Debug Logs module, the full list of debug logs that currently exist in your org will show up, along with information about them, like the ID, size, time of the execution and so on. If you choose a specific log by clicking its ID in the list, the body of the log will be loaded and it will show up in a new tab in the window above the list of logs.
When you open the Debug Log module (or click the 'Refresh' button), Maven Tools queries all the ApexLogs that exist in your org in one API request. However, when you choose a specific log, request will be made for its body, so every time you open a new log, a new API request is sent to your Salesforce org.
¶ Execute your code and view the Debug Log
Every time some code gets executed in your org - like a class, trigger, job and so on, a debug log will be created. We'll create a sample log by running this code in Execute Anonymus:
System.debug('Test');
Once the code is executed, a new debug log will be generated. Click the 'Refresh' button, and the latest log should appear at the top of the list, distinguished by a small icon on the far right, indicating logs that were added after the refresh.
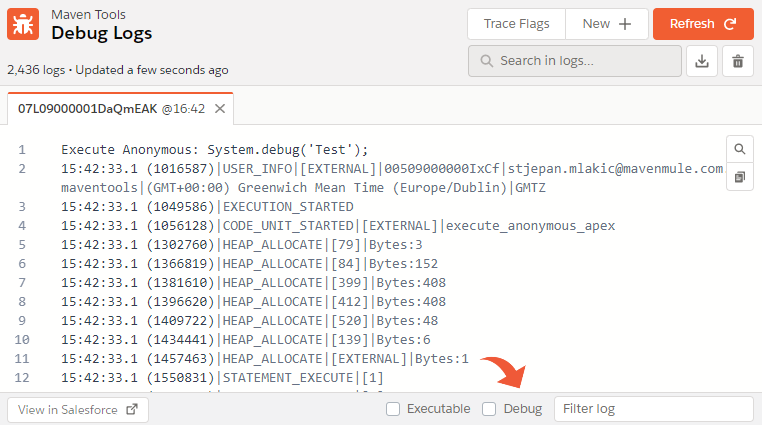
Click on the log's ID to access its content. Upon opening, you can review the executed code and all other information provided by Salesforce. Each line in the debug log comprises three elements:
- Timestamp: The time when the event occurred, along with time elapsed in nanoseconds (in parentheses) since the start of the event
- Event: The event that triggered the debug log entry
- Details: Details about the line of code and the method name where the code was executed.
We won't focus much on the information you get in your logs. For more info about that check out the Debug Log section in Salesforce help.
You can filter your log to show only lines that are Executable or Debug, or filter the log yourself by typing the words that you want to filter by.
¶ Search your debug logs
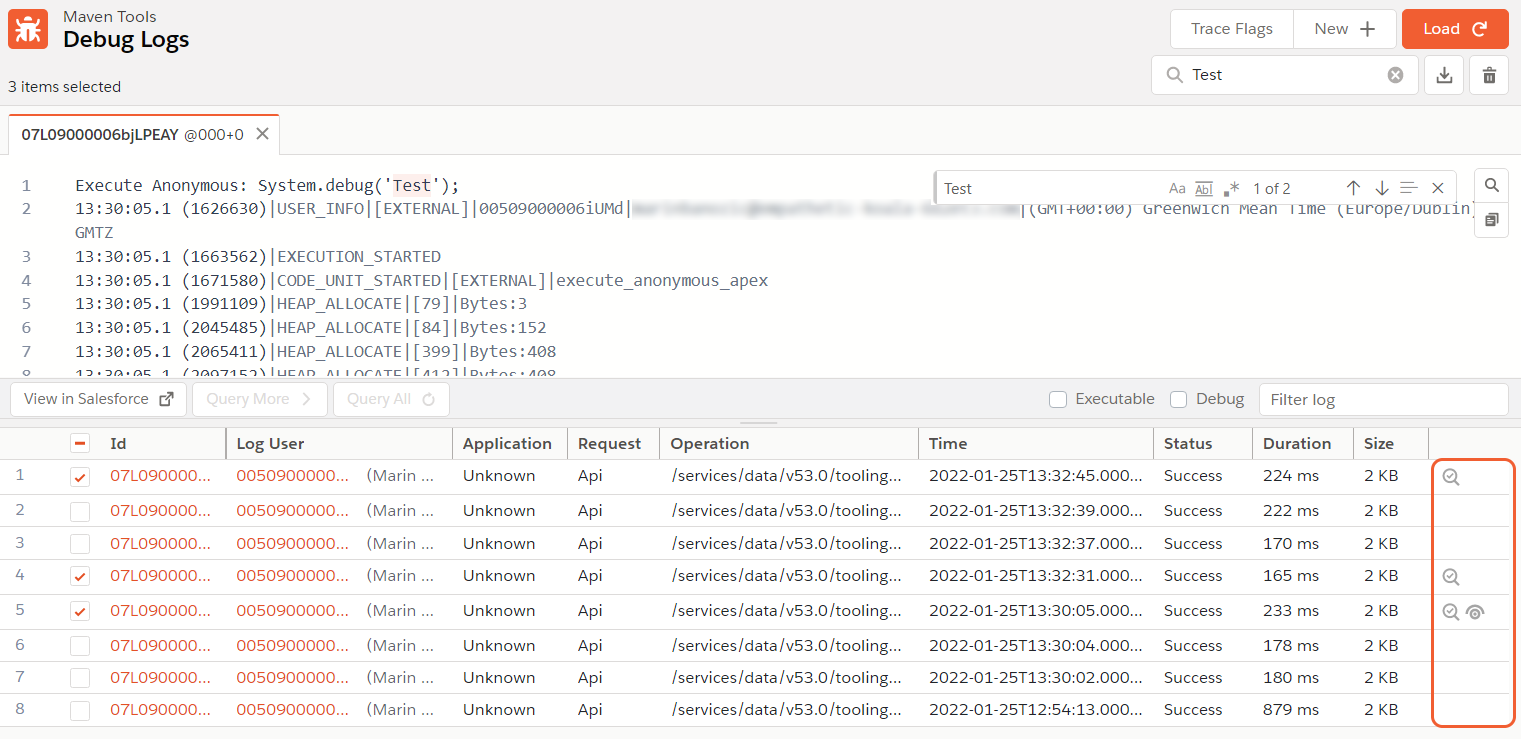
You can search logs by selecting the logs you want to search and entering the text in the "Search in logs..." input field. After pressing Enter, it will look for that text in all the logs you have chosen. The logs containing the specified text will be identified with the icon displayed in the image below (the other icon designates logs currently open in one of the tabs).
¶ Export and delete your logs
You can export your logs to a .txt file by clicking the export button in the upper right corner. You can export just your current log, or you can select multiple logs in the list and export them all at the same time into one .zip archive.
Keep in mind that Salesforce permits the retrieval of a single set of debug log data at a time. If you intend to export multiple logs, a separate API request will be generated for each log.
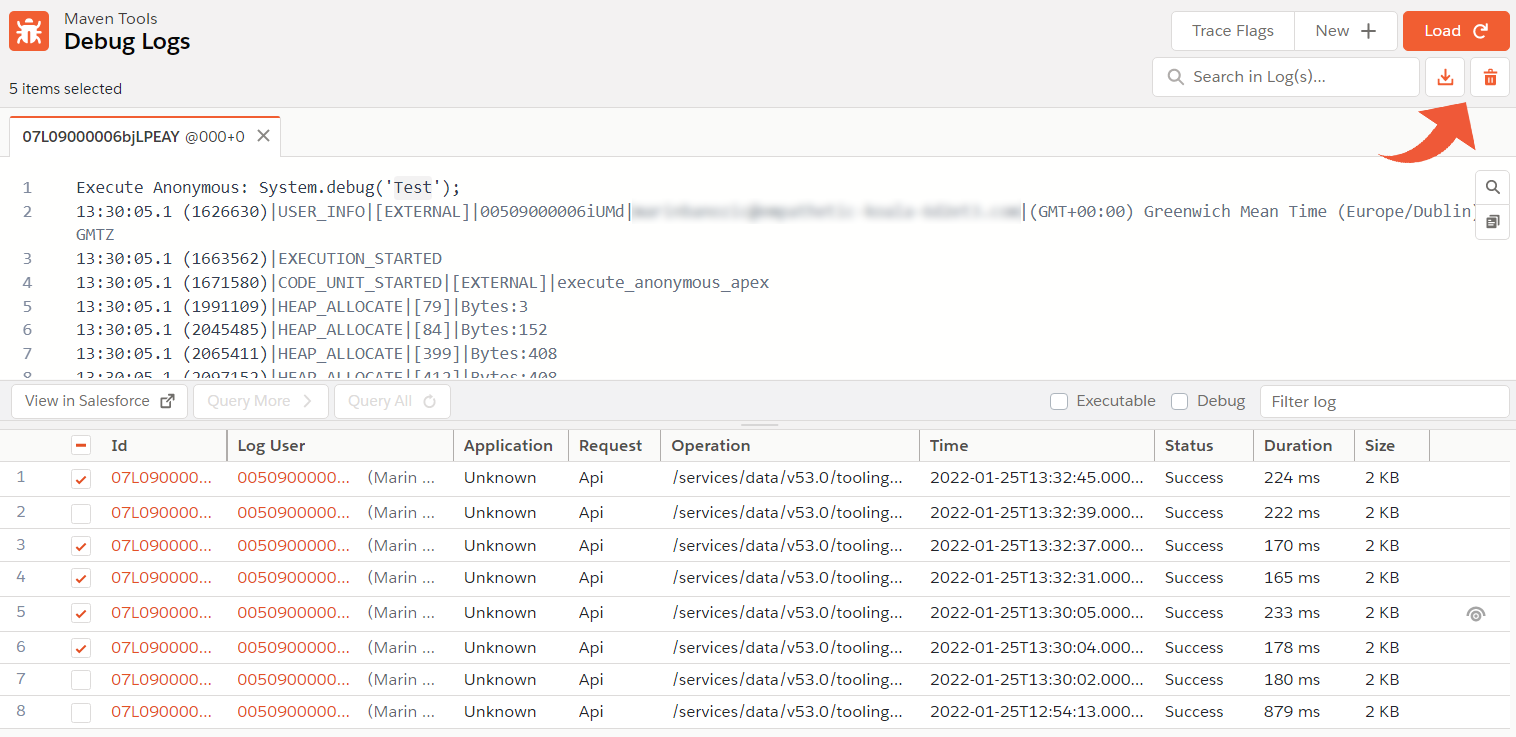
You can also delete logs from your org by clicking the delete button right next to the export button. Just like export, you can delete the current log only or select multiple logs from the list to delete.
You can only delete 200 logs with one API request. If you wish to delete more than that at once, multiple API requests will be made.
¶ Trace Flags
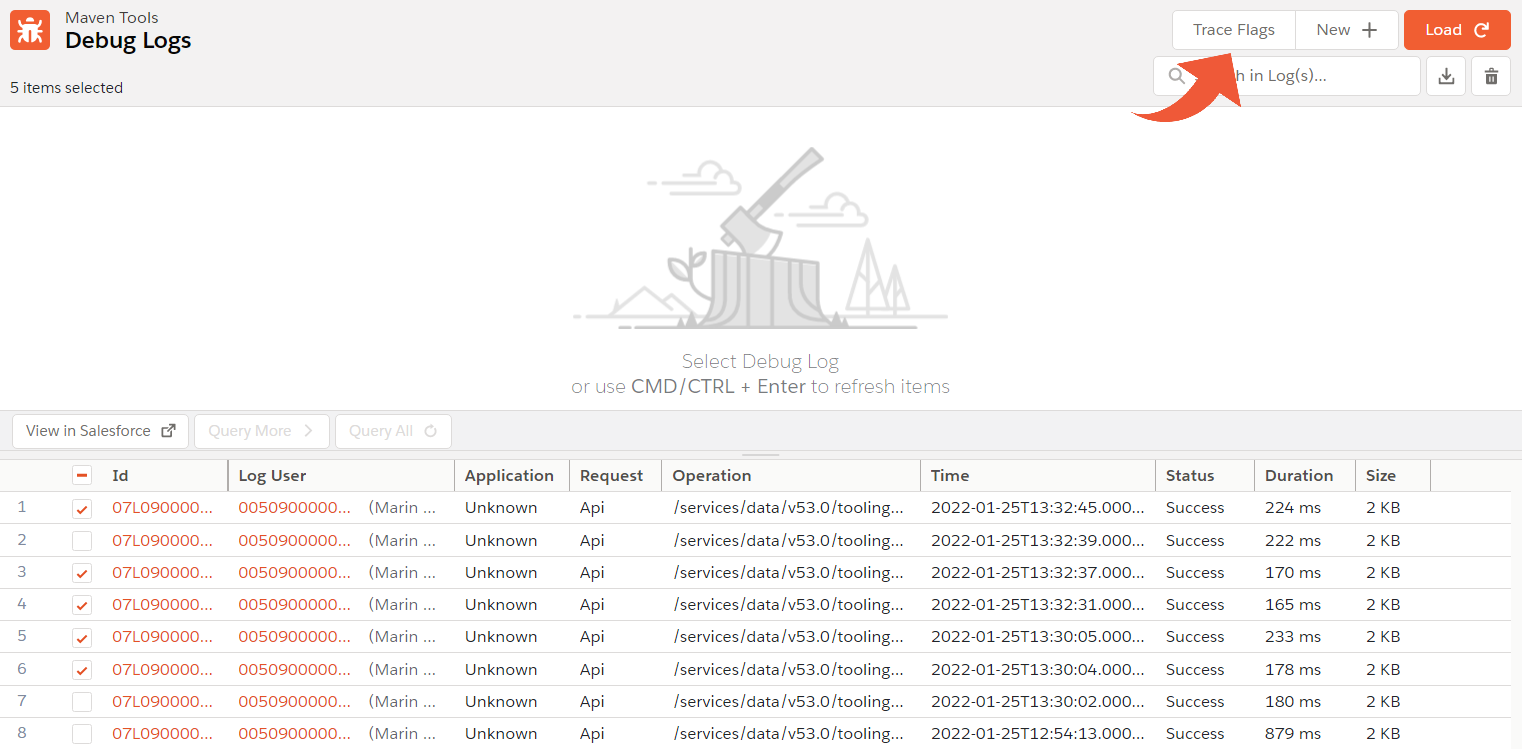
Another feature that the Debug Logs module offers you is to view, create, edit and delete Trace Flags. If you're not familiar with Trace Flags, they are used to set debugging levels for a specific User, Apex Class/Trigger etc. for a specified period of time. To view your current Trace Flags, click the 'Trace Flags' button.

When you open the modal, you can not not only view the trace flags but update them as well by clicking the edit icon on the datatable cell you want to update. You can also do some additional actions by clicking one of the buttons in the controls list:
- Search the list of trace flags
- Extend all the selected trace flags by 1 hour
- Delete all the selected trace flags
- Refresh the trace flags list
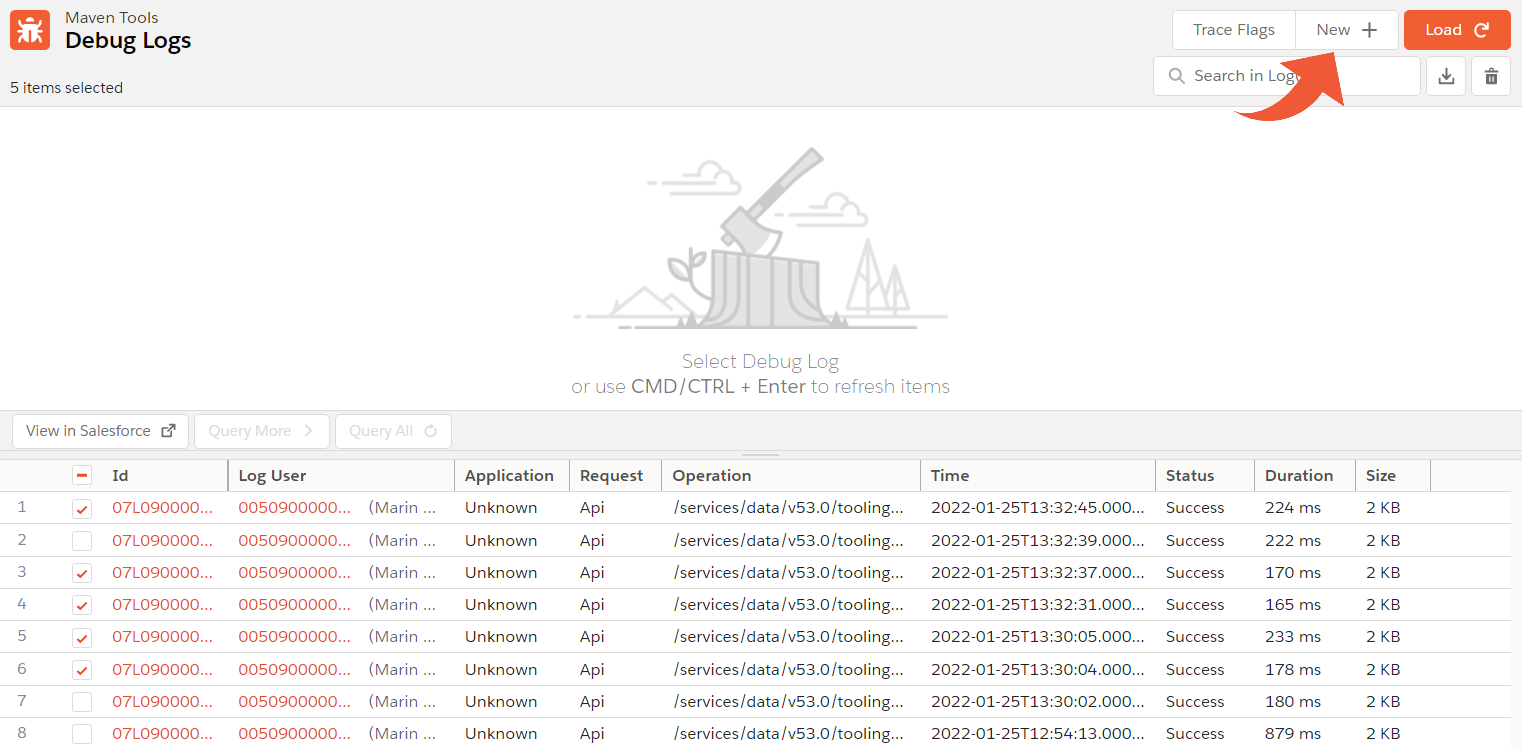
If you want to create a new trace flag, click the 'New' button next to the 'Trace Flags' one:
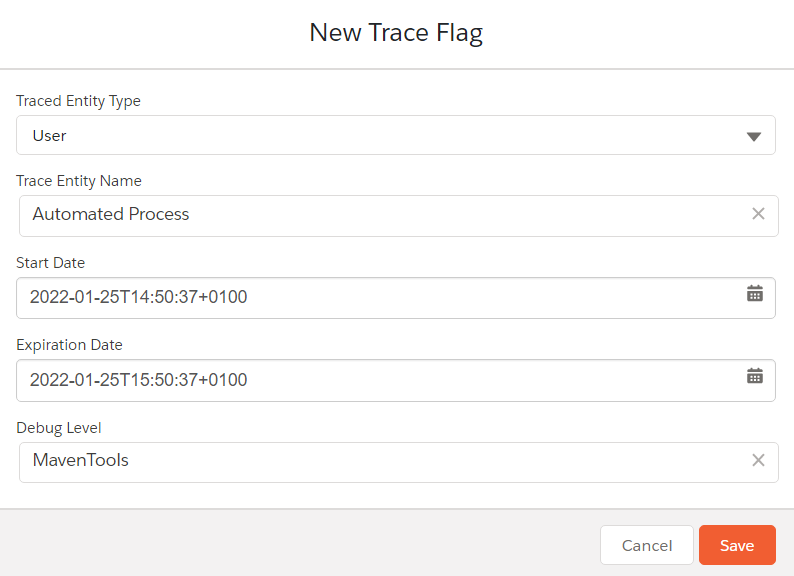
In the new modal, begin by selecting the Traced Entity Type. If you choose a User, Apex Class, or Trigger as the traced entity type, you can then look up the entity in the next input field.
You also need to choose a period for the trace flag to be active, as well as a Debug Level record. By default, the start date is the current time, and the end date is set to one hour after the start date.
Within the Debug Level, you define the logging levels for various categories such as System, Apex Code, Visualforce, etc. You can create a new Debug Level from the Salesforce UI. The MavenTools Debug Level is selected by default, and its settings are visible below.
Here, we've created a new Trace Flag for the Automated Process user. Click 'Save' to preserve the new trace flag.
MavenTools Debug Level is similar to the SFDC_DevConsole Debug Level, with some modifications:

If the Trace Flag was created successfully, you can now reopen the list of trace flags, and you should see that your new Trace Flag is listed there.
¶ Setting the Trace Flag
Depending on whether you had, have, or don't have an active Trace Flag on the current User, Maven Tools will always make sure there's an active Trace Flag.
In order to do this, simply open the Debug Logs page in Maven Tools and you should see a toast:
- If there's an active Trace Flag for the current user, Maven Tools will not attempt to update or create a new Trace Flag.

- If the user has no Trace Flag, Maven Tools will create a new Trace Flag, with 1 hour expiry; its DebugLevel is MavenTools, which you can see the logging levels for above.

- However, if the user has an expired Trace Flag, Maven Tools will automatically update it, extending it by 1 hour from the moment you open the Debug Logs page in Maven Tools.
